


Stack traces
Contents
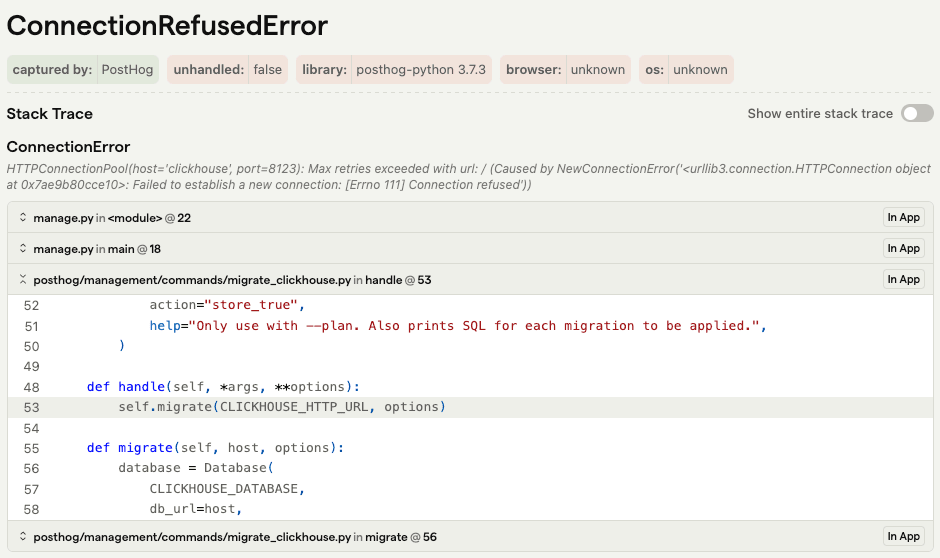
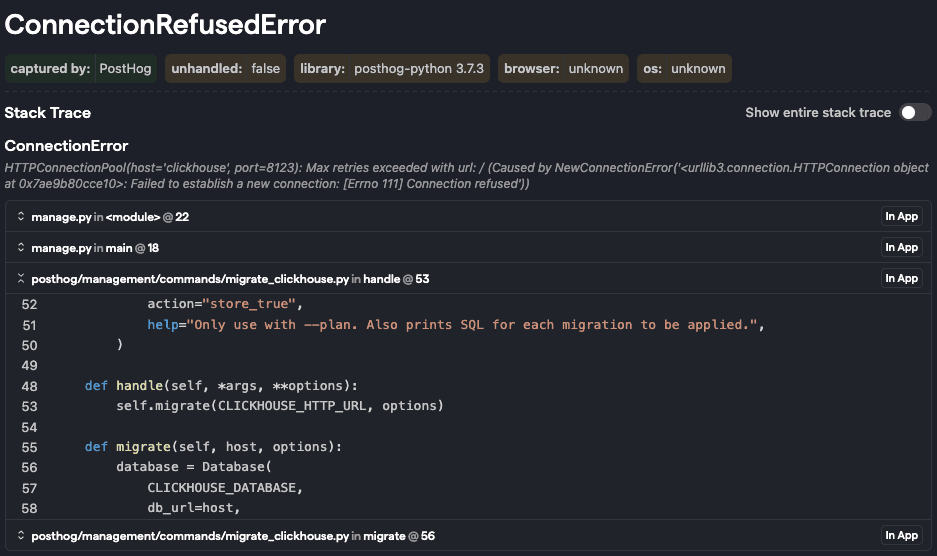
Error tracking enables you to view the stack trace and code context associated with an exception. This can help understand, identify and resolve the root cause of an issue.
Stack traces are available for all languages and can be found in the details page of an issue.
Resolving stack traces
If you use a compiled language or server minified bundles, you'll need to upload source maps to get stack traces. Compiled or minified code obfuscates the original source code, so PostHog uses the source map to resolve the stack trace to the original source code.
For languages like Python, the stack trace and code context can be gathered by the PostHog client and requires no additional processing.
Uploading source maps
If your source maps are not publicly hosted, you will need to upload them during your build process to see unminified code in your stack traces. You can either use the @posthog/nextjs-config package or the posthog-cli to handle this process. Select your platform to view instructions.


Release context in stack traces
Error tracking displays release information over stack traces to help you track down the root cause of an issue, down to the commit and version that produced it. This context can be defined when you upload sourcemaps.
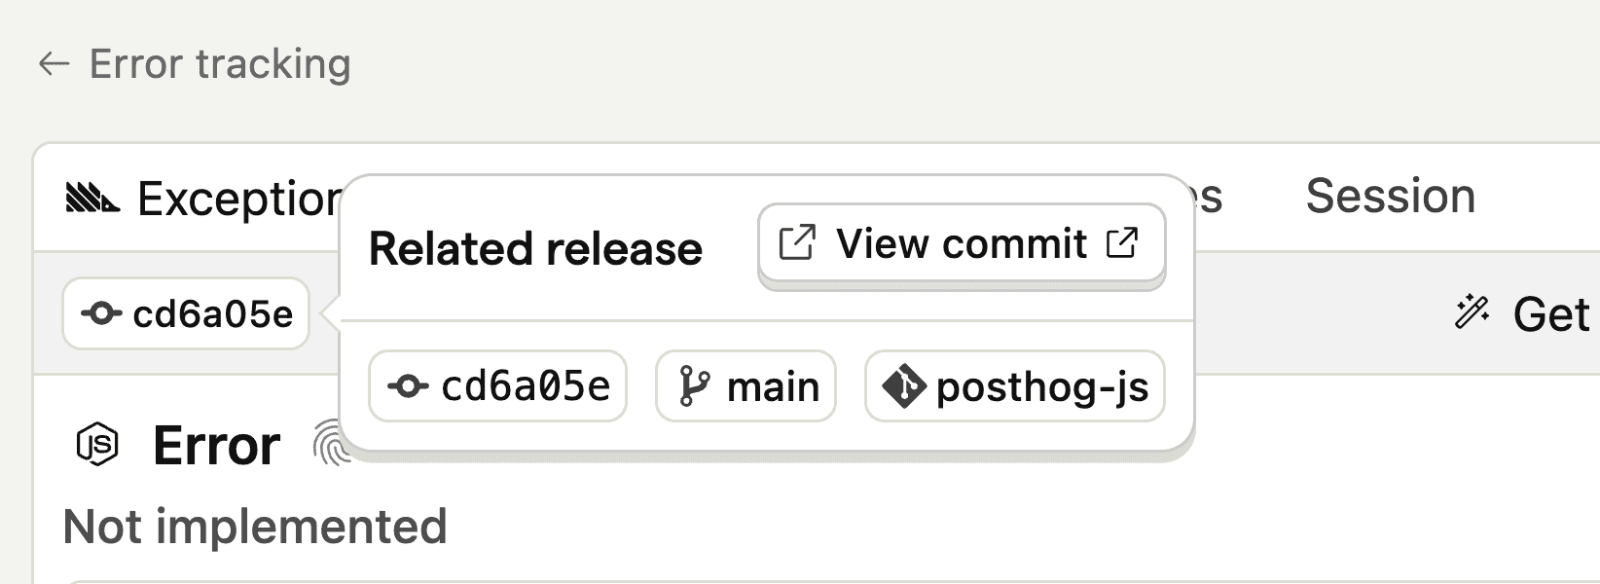
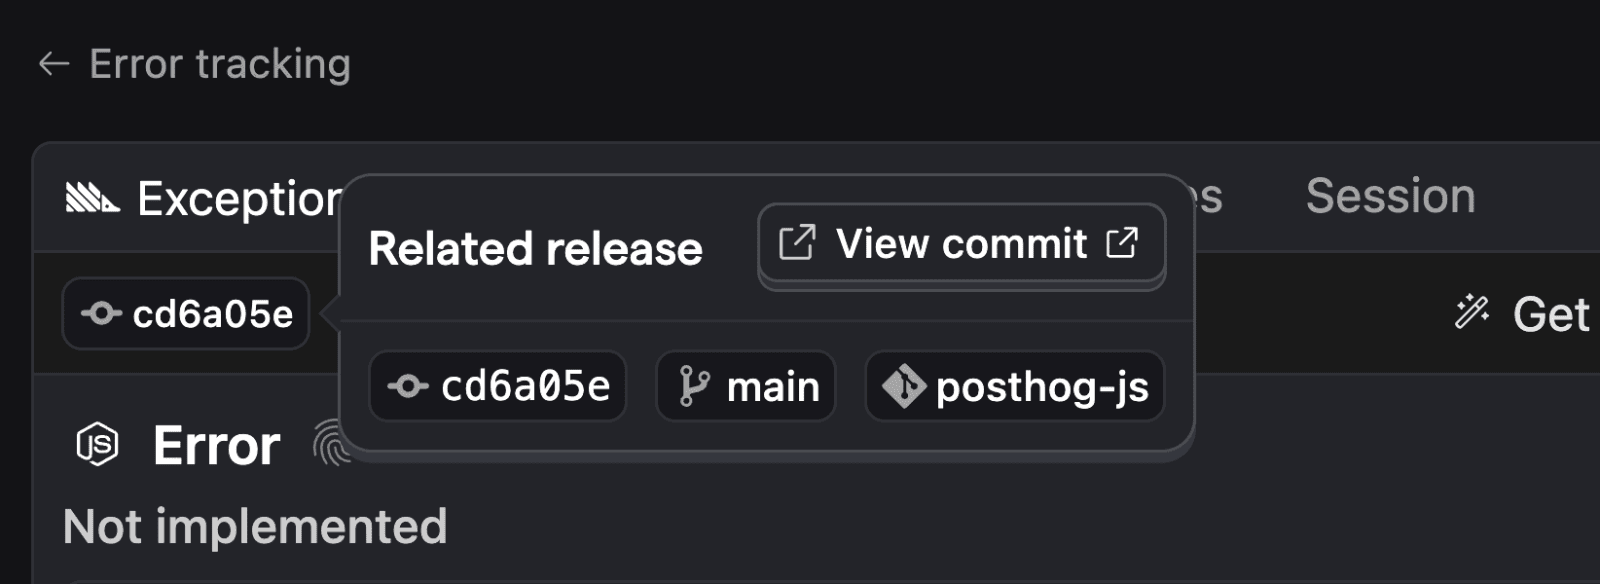
Learn more about releases in error tracking.
Source linking
When viewing stack traces in PostHog, you can click directly through to the relevant code in your GitHub or GitLab repository. Each stack frame includes a View commit button (displayed using a GitHub or GitLab icon) that links to the exact file and line where the error occurred.

Source linking requires a GitHub or GitLab integration and a release with repository information. Once set up, PostHog automatically adds source links to your stack traces.
Troubleshooting symbol sets
Compiled or minified languages requires additional information to perform a process called symbolification to produce the same stack trace and code context output shown above. The additional information is known as a symbol set.
The source of a frame in the exception stack trace should point to the minified code of your application which should contain the sourceMappingUrl parameter denoting the location of the source map. These files must either be publicly accessible for PostHog to fetch or uploaded manually to symbolify the stack trace.
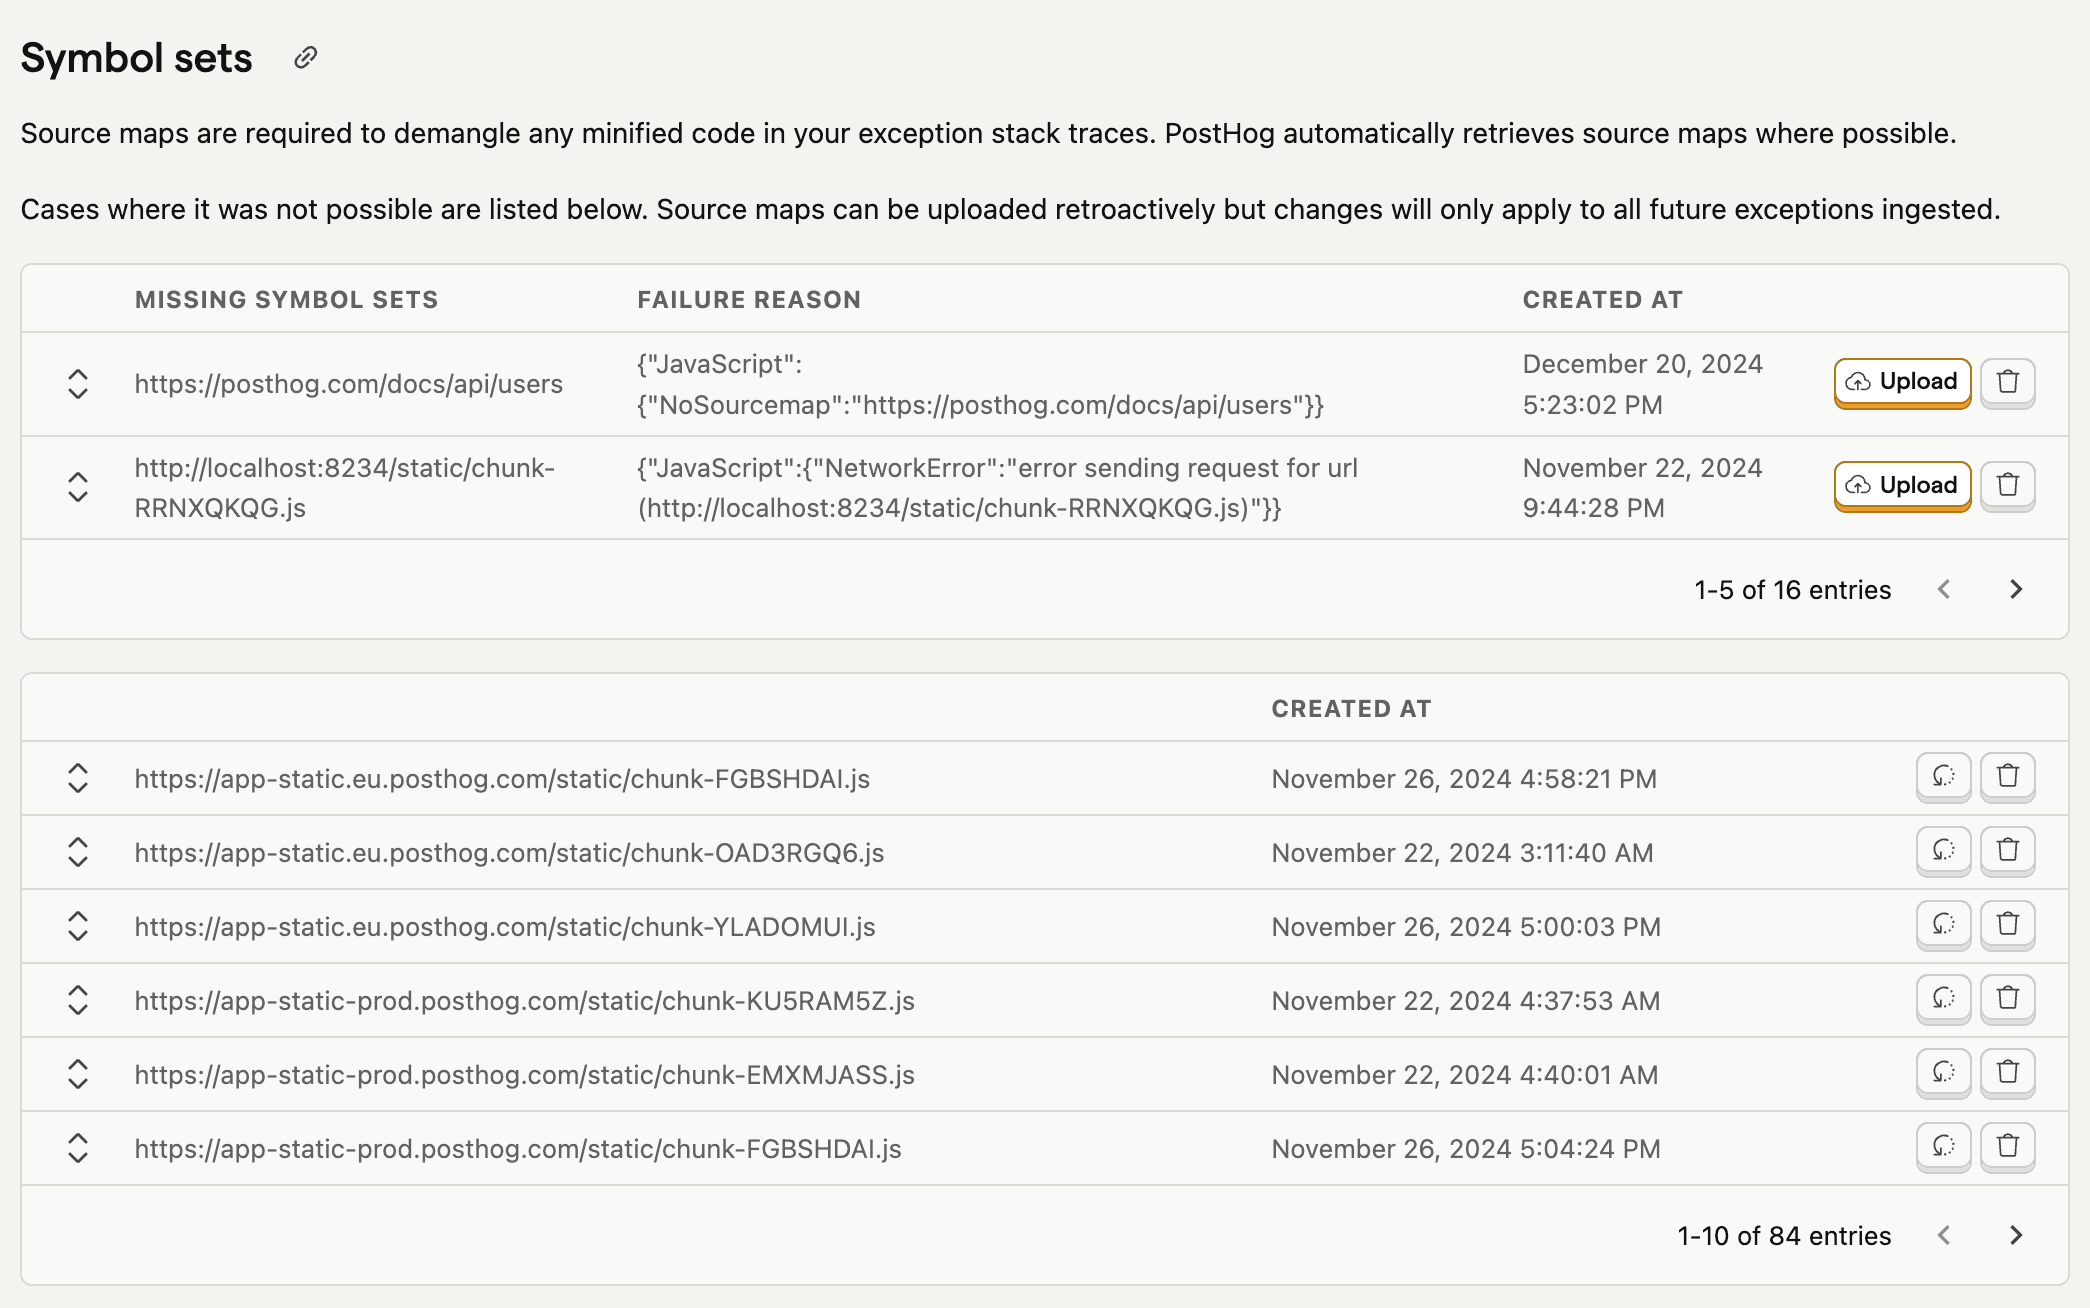
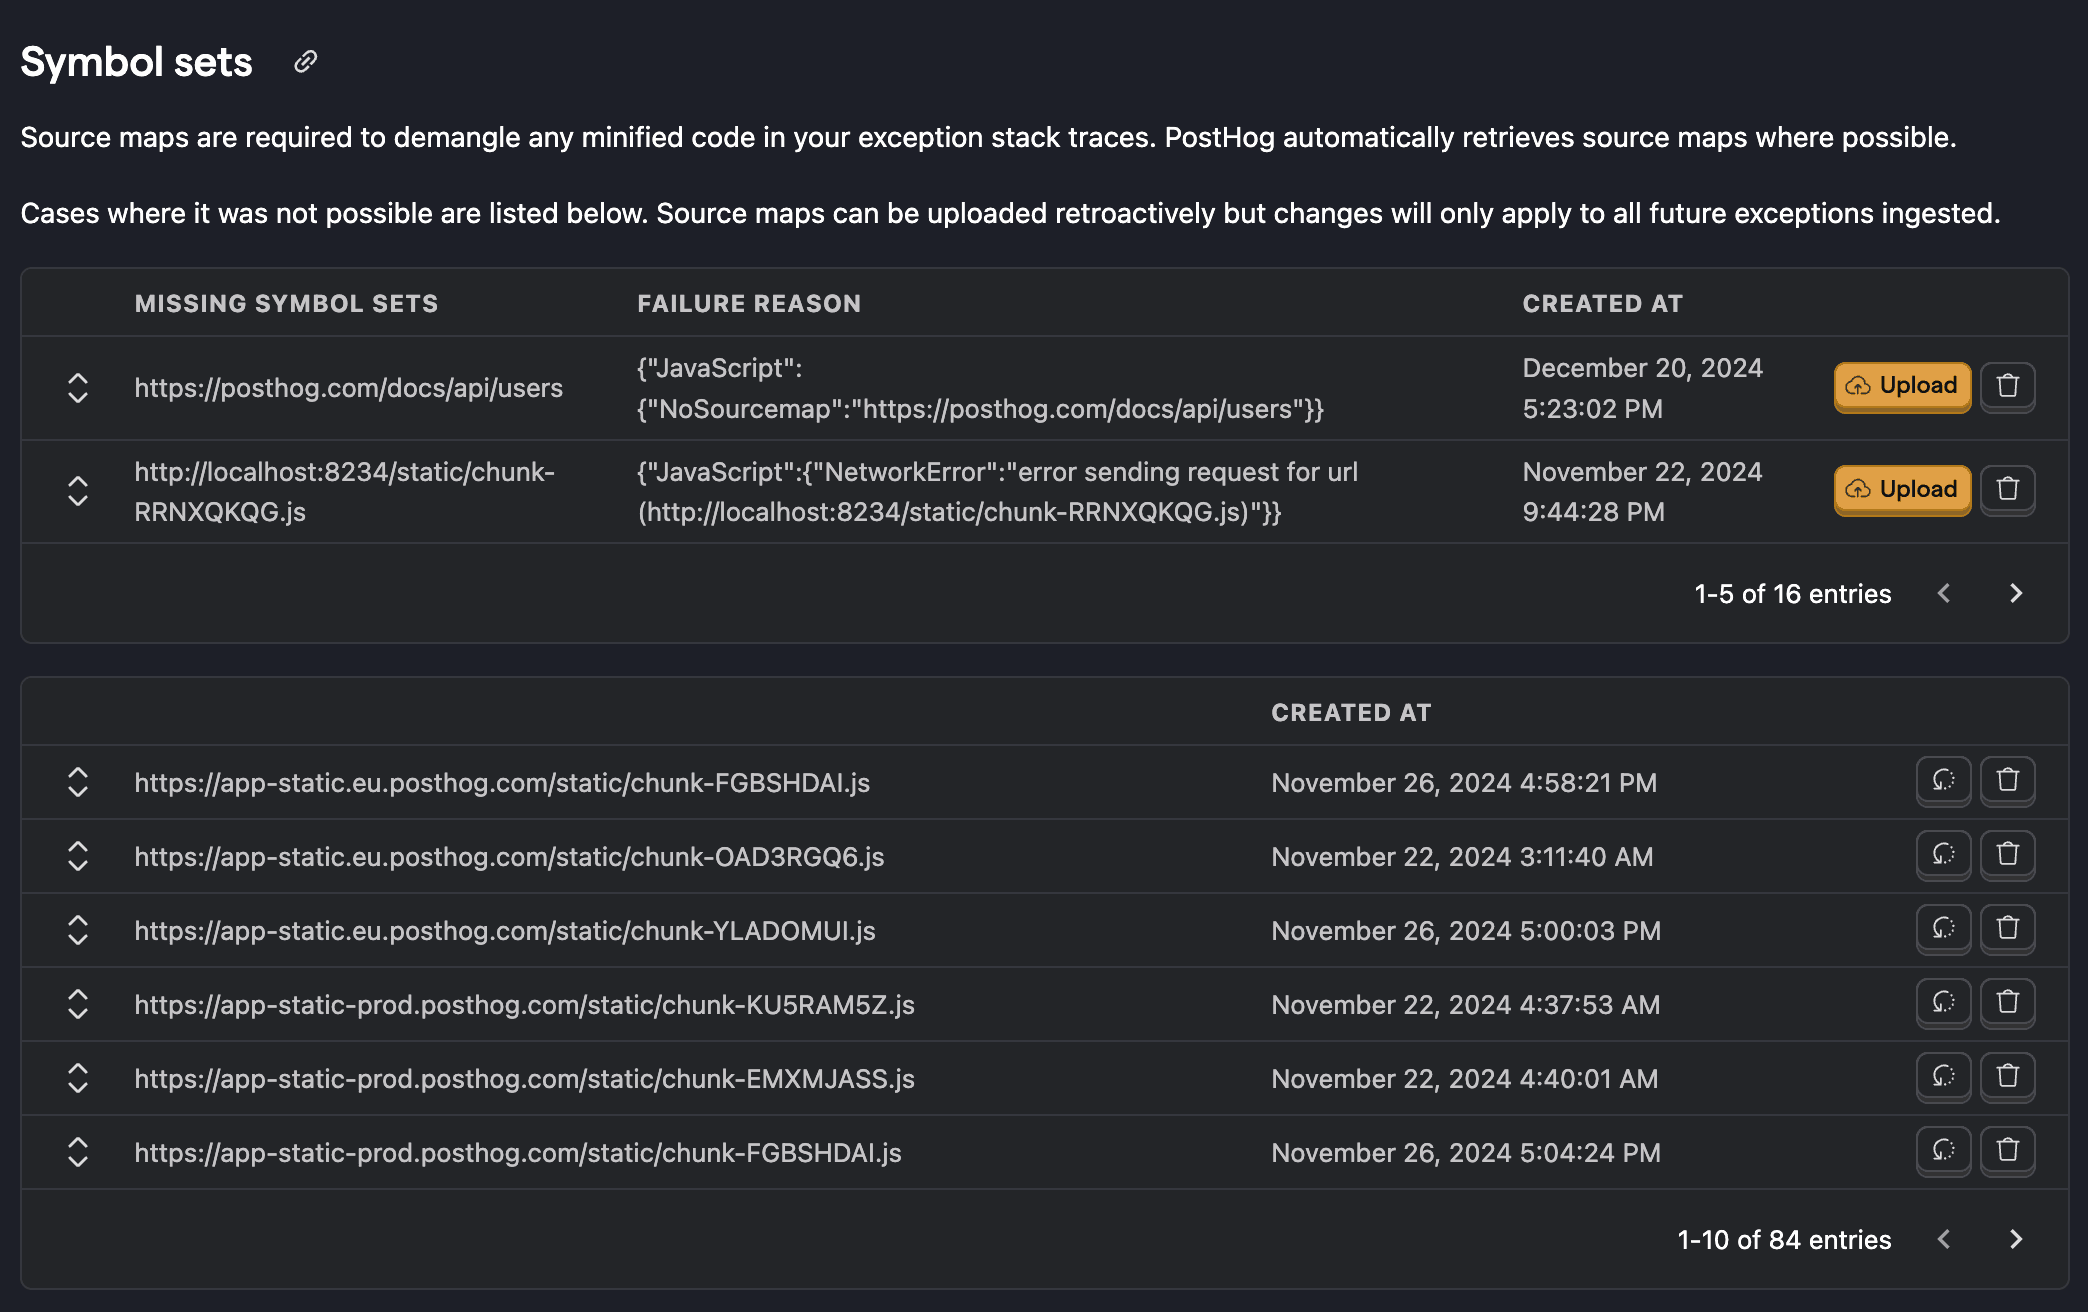
You can see the symbol sets fetched by PostHog and the associated frames within the error tracking settings. Any missing symbol sets will also be present along with the failure reason. From here, you can also manually upload missing symbol sets or replace existing ones.
We strongly recommend you follow the upload source maps guide to ensure your stack traces are uploaded automatically in CI instead of manually debugging the process. If you're still having issues, let us know in-app.